
On a work related web site I made two posts on January 15th, at 7.35 in the morning.
In the following few hours my tiny server took quite a beating, at least compared to what it normally gets. The activity was sufficient to make the site periodically unresponsive.
It is not the first time this happens, and it is related to ActivityPub.
For those interested, the website is History Walks Venice, and the Mastodon handle is @info@historywalksvenice.com.
The Problem
The main problem I encountered was that my websites went unresponsive for periods after the two scheduled posts were published at 7:35.
It didn’t happen immediately, and it wasn’t all the time.
The problem persisted for a couple of hours.
When I first noticed, I was walking the dogs, so I couldn’t inspect the server immediately. When I came back, the sites were responding again, but then it happened a few times more.
Traffic
The table below shows the number of hits with a User-Agent containing the word Mastodon, aggregated by the hour for the entire morning.
This data is from the Apache access log.
| Hour | Total requests | Mastodon requests | % Mastodon |
|---|---|---|---|
| 6 | 1117 | 74 | 7% |
| 7 | 3048 | 1789 | 59% |
| 8 | 6060 | 3978 | 66% |
| 9 | 5238 | 3419 | 65% |
| 10 | 1782 | 133 | 7% |
| 11 | 1659 | 65 | 1% |
Mastodon instances are generating quite a bit of traffic, which is to some extent also the intent and purpose of sharing posts on the Fediverse.
The spikes are even more localised that the table above indicates. For example, in the period 8:00-8:59 there were 1194 Mastodon requests in the single minute 8:23, 947 requests at 8:00, 409 at 8:14 and 350 at 8:32. That is half the requests for that hour, in four separate minutes. In the period 9:00-9:59 a total of 3178 requests arrived between 9:04 and 9:07.
The traffic spikes are not because of a huge following. The site has about thirty followers. However, the posts did mention a group with over 4K followers, which must have widened the reach substantially. Again, this is what I wanted.
Instances
All in all some 766 Mastodon instances chimed in, most of which only made a dozen or so requests. Only 17 instances made twenty or more requests, 589 made 10–19 requests, and 160 made less than ten requests.
Here is the top ten in terms of requests to my server in those six hours:
| Instance | Requests | Top101 | Followers |
|---|---|---|---|
| https://mastodon.world/ | 491 | 9 | Yes |
| https://red.niboe.info/ | 195 | ||
| https://mastodon.social/ | 84 | 1 | Yes |
| https://nafo.uk/ | 44 | ||
| https://pawoo.net/ | 31 | 2 | |
| https://mastodon.green/ | 28 | ||
| https://nerdculture.de/ | 27 | ||
| https://mstdn.jp/ | 24 | 3 | |
| https://mozilla.social/ | 24 | ||
| https://corteximplant.com/ | 23 |
The instance mastodon.world alone made over 150 requests/hour to my site for a period of 3 hours, all because of two posts.
The second, red.niboe.info, appears to be a Spanish language, invite-only instance.
Why the difference? I suspect it has something to do with how the instances cache the results of lookups on other instances.
Requests
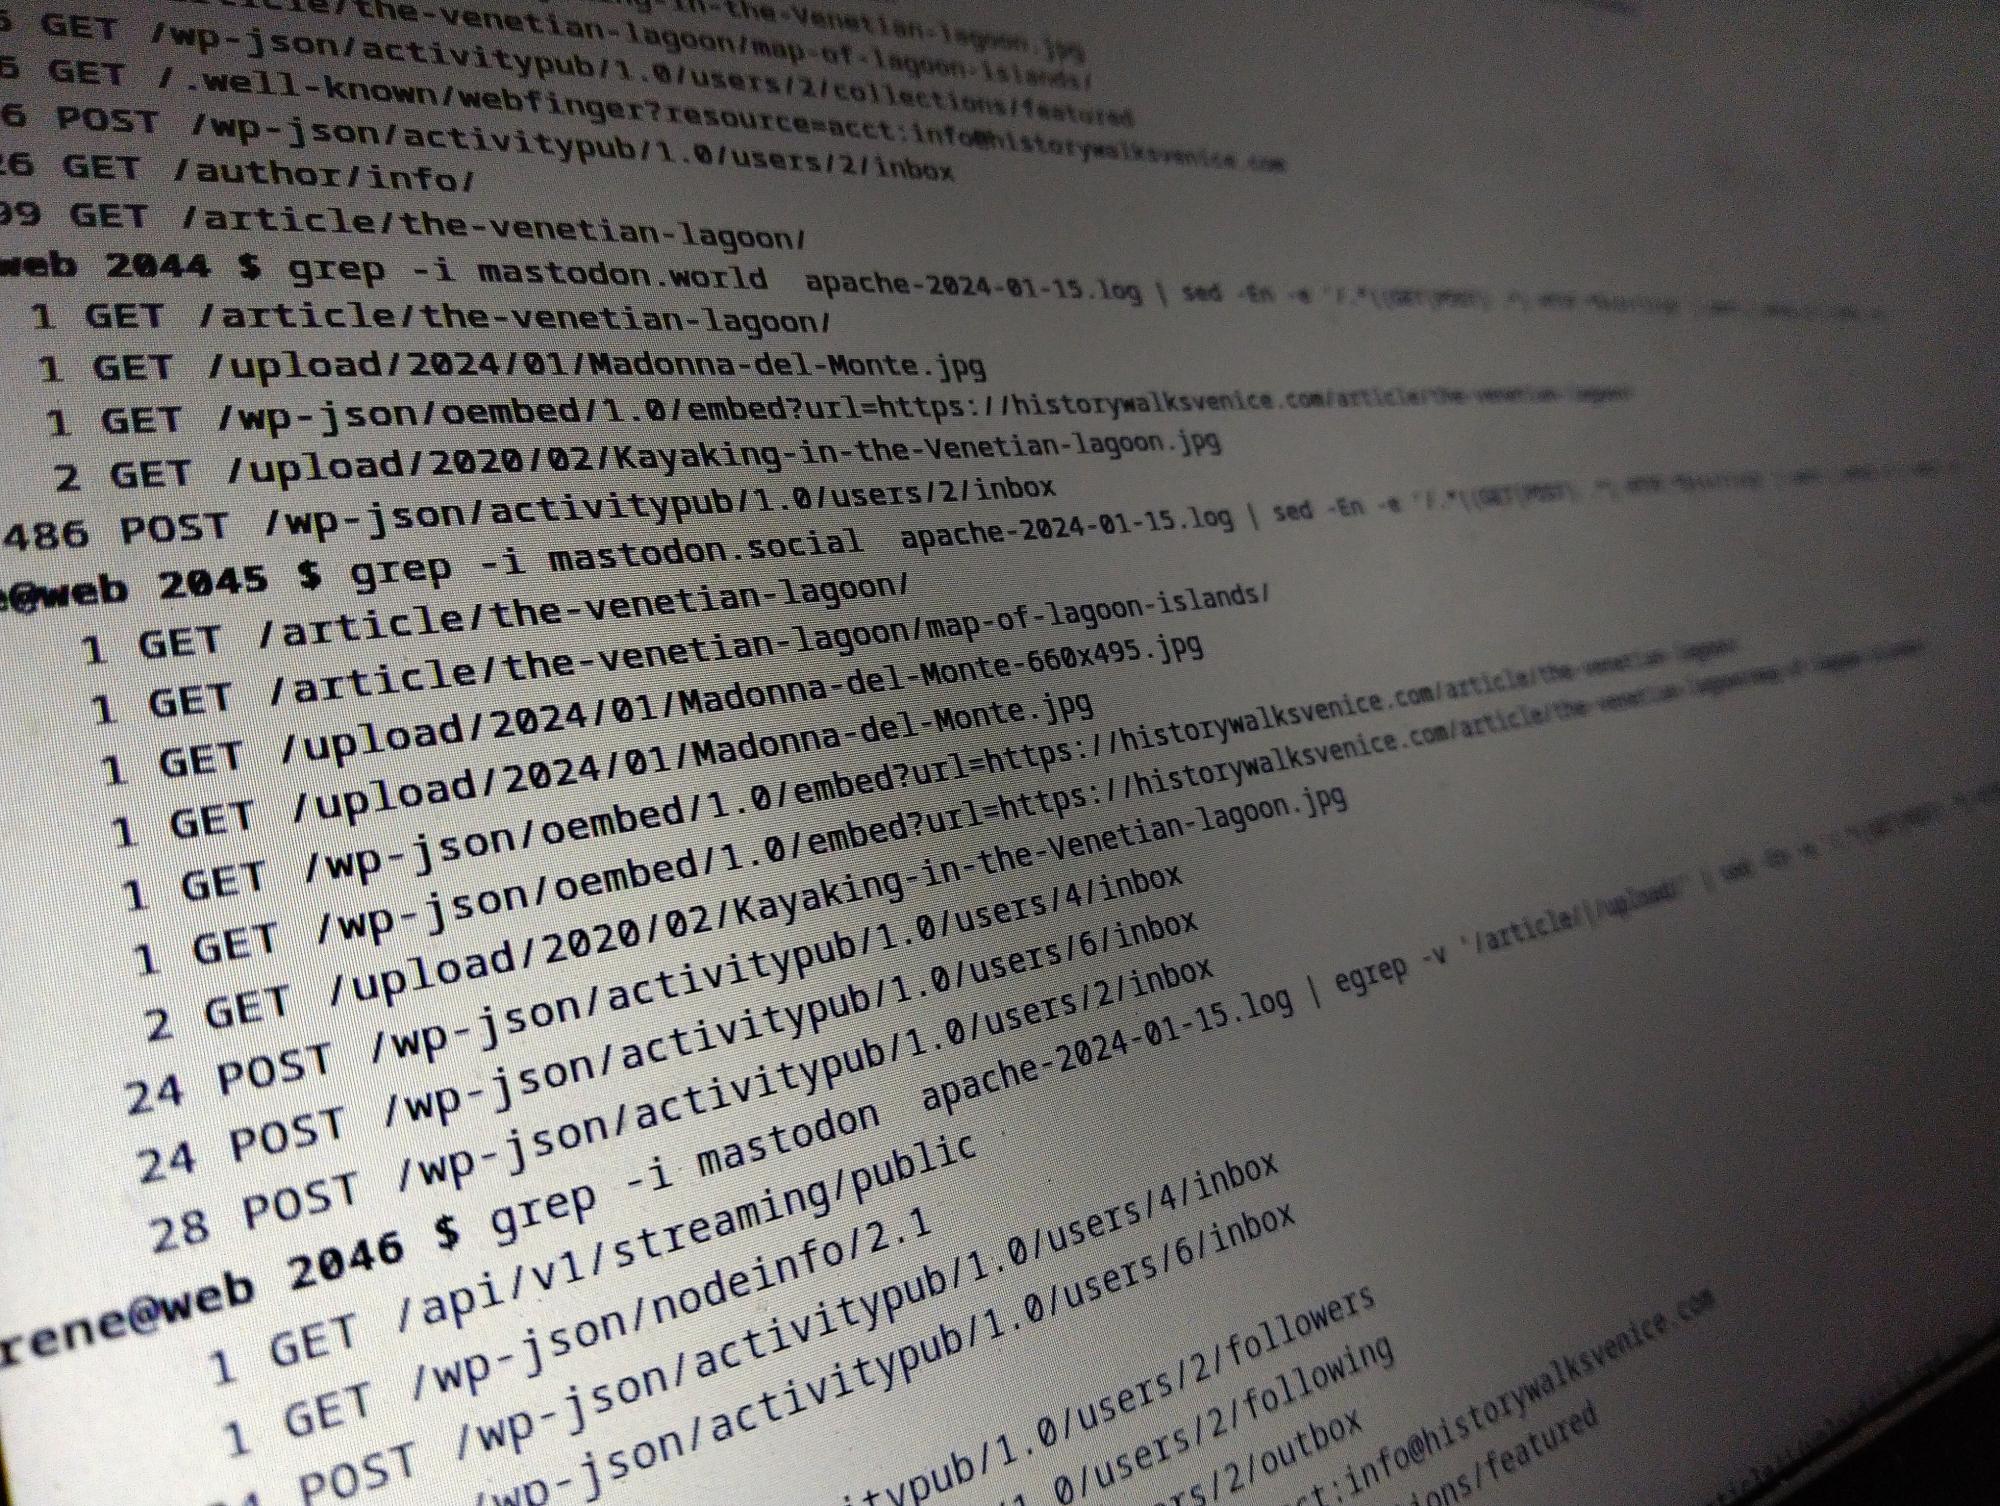
Here’s a breakdown of what the Mastodon instances requested from my site on the morning of January 15th when the two posts were published.
I have removed requests for posts and media, which simply means somebody views the posts on Mastodon, which is fine. That what I want.
These requests are behind the scenes requests.
| HTTP request | Count |
|---|---|
| GET /author/info/ | 854 |
| POST /wp-json/activitypub/1.0/users/2/inbox | 794 |
| GET /wp-json/activitypub/1.0/users/2/collections/featured | 754 |
| GET /.well-known/webfinger?resource=acct:info@historywalksvenice.com | 749 |
| GET /wp-json/activitypub/1.0/users/2/outbox | 668 |
| GET /wp-json/activitypub/1.0/users/2/following | 567 |
| GET /wp-json/activitypub/1.0/users/2/followers | 494 |
| GET / | 95 |
| POST /wp-json/activitypub/1.0/users/6/inbox | 24 |
| POST /wp-json/activitypub/1.0/users/4/inbox | 24 |
| GET /wp-json/nodeinfo/2.1 | 1 |
| GET /api/v1/streaming/public | 1 |
User ‘info’, uid 2, is the one making the posts. The requests for users 4 and 6 were from mastodon.social because I tested the WordPress ActivityPub there, and it remembers.
Of the requests from mastodon.world, all but 5 was for “POST /wp-json/activitypub/1.0/users/2/inbox“. That is, one of the top ten Mastodon instances made 486 identical requests over three hours, while apparently one or two persons saw the posts there. The instance made one (1) request for a post, 3 requests for media and one oEmbed request.
Why?
All this because my website went unresponsive for a few periods, about an hour or two after the posts were published.
Obviously, I want my sites responsive, and especially when I’ve just published posts.
Server and software
The server runs Debian stable, with up-to-date vanilla Apache and MariaDB. It is a VPS with 2vCPUs, 4Gb of ram with 2Gb of swap for emergencies. It is not large, but neither is it the smallest you can get. Apache is configured to allow up to 100 worker processes.
The site is WordPress with the ActivityPub plugin active. Both are up-to-date. There’s a page cache, and a redis backed object cache active.
There are some other sites on the server, but they are very low traffic, and don’t use ActivityPub.
Unresponsiveness
The first thing I noticed was that the problem was not the server as such. I had no problem logging in while the site didn’t respond. There are no OOM messages in the system logs.
It wasn’t a network problem, as I can hardly use one percent of the bandwidth the server has. The hosting provider’s statistics show no spikes in traffic volume.
The server as such was not unresponsive, the websites it served were.
The problem was Apache, but there’s no easy solution.
I’ve checked the response times of the requests made by the Mastodon instances, and there’s nothing obviously slow.
My current suspicion is that the many requests causes Apache to run out of request workers. Numerous requests in a very short time uses up the available worker processes, and if the Mastodon instances keep the connection alive for subsequent requests (I don’t know if they do), they are not relinquished immediately for other requests from other clients.
I have set the limit of worker processes (with the MPM prefork) to 100, which will be the maximum number of concurrent requests.
There’s nothing in the error_log, though. I would have expected to find a message there, if Apache runs out of worker processes.
Conclusion
I haven’t solved my problem, and I’d be happy for any suggestions about how to proceed.
What I have found out, is that if you use the ActivityPub plugin with a larger following or, as in this case, by mentioning a large group which boosts your post immediately, hordes of Mastodon instances will come down hard on your cosy little server, and not all are well-behaved.
Just in this case, I’ve seen at least two instances with a less than optimal behaviour.
Footnotes
- The ranking is from instances.social. ↩︎
Leave a Reply